
Inferential Statistics Examples: Drawing Conclusions and Making Predictions from Data
Inferential statistics is a powerful branch of statistics that allows researchers to draw conclusions about a population based on sample data. Unlike descriptive statistics, which focus on summarizing and describing data, inferential statistics involves making inferences, testing hypotheses, and predicting future outcomes. By applying statistical models to a sample, inferential statistics helps us generalize findings to a larger population.
In this blog post, we will explore various examples of inferential statistics, key methods, and concepts such as hypothesis testing, confidence intervals, and regression analysis. Let’s dive into how inferential statistics plays a crucial role in data analysis and decision-making.
Descriptive vs. Inferential Statistics
Before delving into inferential statistics, it is essential to understand its distinction from descriptive statistics.
- Descriptive Statistics: Summarizes raw data by calculating measures like mean, median, mode, range, and standard deviation. These statistics describe the data in a way that is easy to understand.
- Example: The mean income of 100 households in a neighborhood.
- Inferential Statistics: Uses data from a sample to make generalizations or predictions about a larger population. It involves hypothesis testing, confidence intervals, and statistical models to infer conclusions beyond the immediate data.
- Example: Using a sample of 1000 voters to predict the outcome of a national election.
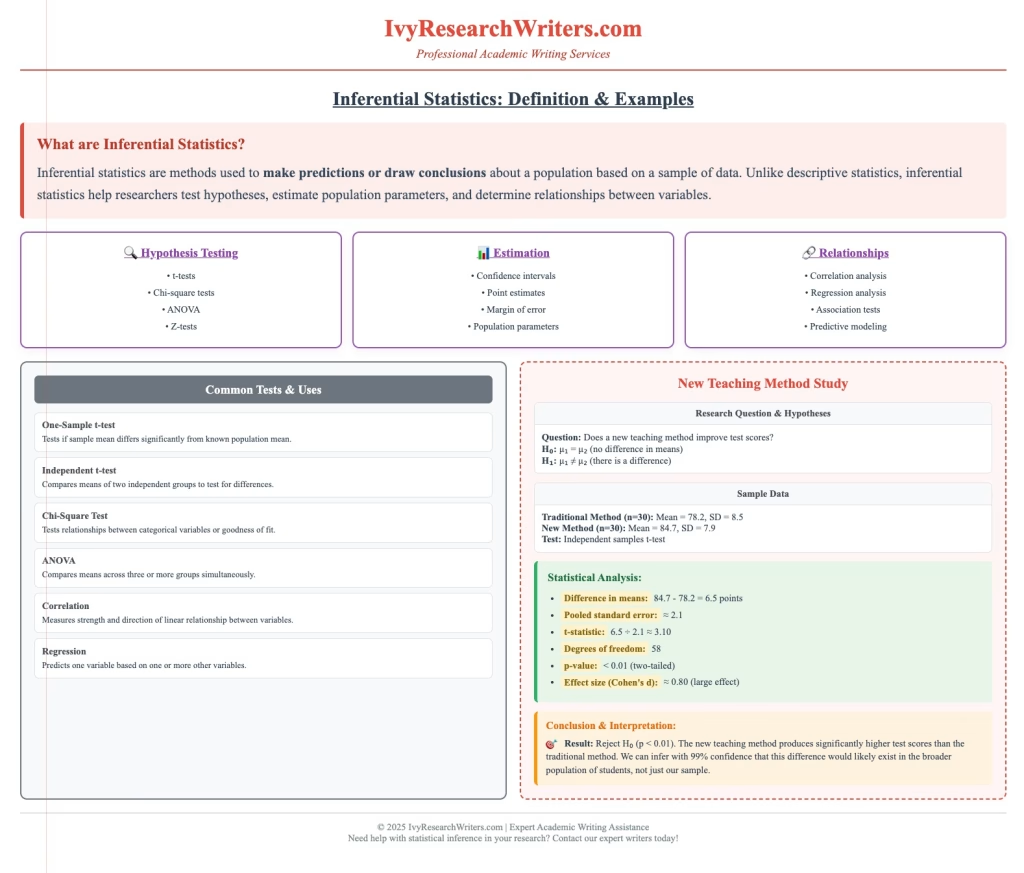
What Is Inferential Statistics?
Inferential statistics allows researchers to go beyond descriptive data and make predictions or draw conclusions about a population based on a sample. It uses probability theory and statistical techniques to assess the reliability of these conclusions.
Key techniques in inferential statistics include:
- Confidence intervals: Estimating a range in which a population parameter (like the mean) is likely to fall.
- Hypothesis testing: Testing predictions or assumptions about a population.
- Regression analysis: Identifying relationships between variables to predict outcomes.
Example: If we know that 50% of 500 sampled students are in favor of a new school policy, we can infer that about 50% of the entire student population (using inferential statistics) supports the policy.
Types of Inferential Statistics
There are different types of inferential statistics depending on the research question and the data type. The most common types include:
- Hypothesis Testing: Used to test claims or assumptions about a population. This can involve:
- T-tests: Used to compare the means of two groups (e.g., comparing the test scores of two classes).
- Analysis of Variance (ANOVA): Used to compare the means of more than two groups.
- Chi-square tests: Used to examine relationships between categorical variables.
- Regression Analysis: Used to understand the relationship between one dependent variable and one or more independent variables.
- Linear regression: Predicts the value of a continuous dependent variable based on the value(s) of one or more independent variables.
- Logistic regression: Used when the dependent variable is categorical (e.g., predicting whether a customer will buy a product: Yes/No).
- Confidence Intervals: Provide a range of values within which a population parameter is expected to lie with a certain degree of confidence.
- Example: A confidence interval of ±5% means the estimate is within 5% of the true population value.
Sampling: A Core Element of Inferential Statistics
Sampling is the process of selecting a subset (sample) from a larger population. Inferential statistics depends heavily on the sample data to make conclusions about the whole population. The quality and representativeness of the sample are crucial for drawing valid inferences.
- Random sampling: Ensures every individual in the population has an equal chance of being selected. This minimizes bias.
- Sample size: Larger samples typically lead to more accurate and reliable conclusions.
- Representative sample: A sample that reflects the characteristics of the entire population.
Hypothesis Testing in Inferential Statistics
Hypothesis testing is a fundamental component of inferential statistics, used to determine whether a hypothesis about a population is supported by sample data.
- Null hypothesis (H0): The hypothesis that there is no significant effect or difference in the population.
- Alternative hypothesis (H1): The hypothesis that there is a significant effect or difference.
Steps in hypothesis testing:
- State the hypothesis: Define the null and alternative hypotheses.
- Choose a significance level (alpha): Commonly set at 0.05, indicating a 5% chance of error.
- Calculate the test statistic: Based on sample data (e.g., t-statistic, p-value).
- Draw a conclusion: Reject or fail to reject the null hypothesis.
Example: Testing whether a new drug reduces blood pressure more effectively than a placebo.
Understanding and Applying Statistical Inference
Inferential statistics is an essential field of statistics that allows us to draw conclusions about a larger population based on sample data. By leveraging statistical methods and tests, inferential statistics goes beyond just summarizing data (as done in descriptive statistics) and enables researchers to make predictions, test hypotheses, and infer characteristics of a population.
Inference in Statistical Analysis
- Inference in statistics refers to the process of drawing conclusions about a larger population based on data from a sample.
- Statistical inference involves using techniques such as confidence intervals, hypothesis testing, and regression analysis to make decisions or predictions.
- Example: If you collect data from a sample of 500 voters about their voting preferences, you can make inferences about the entire population of voters using inferential statistics.
Descriptive and Inferential Statistics
- Descriptive statistics helps us summarize and organize sample data, whereas inferential statistics uses that sample data to make generalizations or predictions about a larger population.
- Descriptive statistics examples: The mean, median, and standard deviation of test scores.
- Inferential statistics allows us to estimate population parameters, test hypotheses, and make inferences beyond the data at hand.
Inferential Statistics Definition
- Inferential statistics refers to the branch of statistics that uses sample data to make inferences about a larger population.
- It involves hypothesis testing, confidence intervals, and regression analysis, all of which help researchers test assumptions and draw conclusions about the population.
- Example: Using a sample mean from a survey to estimate the average income of an entire country’s population.
Explore the full potential of your data with inferential statistics
“Whether you’re working on a research project, business analysis, or academic writing, we’re here to help you make accurate inferences, predictions, and conclusions. Get expert support from Ivy Research Writers today!”
Population Parameter and Sample Statistics
- Population parameter: A numerical value that represents a characteristic of a population (e.g., the mean income of all people in a country).
- Sample statistics: A numerical value calculated from a sample of data (e.g., the mean income of a group of 1000 people).
- Inferential statistics uses sample statistics to estimate population parameters.
- Example: From a sample of 1000 people, we might estimate the average income of the population. The sample mean becomes our estimate of the population’s mean.
Making Inferences with Inferential Statistics
- Inferential statistics helps us make predictions, test hypotheses, and draw general conclusions about a population based on sample data.
- Example: After surveying a random sample of 2000 customers, we can infer whether the entire customer base prefers product A over product B.
Inferential Tests
Inferential tests allow researchers to compare groups, test relationships, and make predictions:
- t-tests: Compare the means of two groups to determine if there is a statistically significant difference between them.
- ANOVA (Analysis of Variance): Compares the means of more than two groups.
- Chi-square tests: Assesses the relationship between categorical variables.
- Regression analysis: Models relationships between variables, allowing for prediction.
- Example: A t-test can be used to compare the average sales of two marketing campaigns to determine if one is significantly more effective than the other.
Inferential Statistics Methods
- Parametric tests assume that the data follows a normal distribution. These include tests like t-tests, ANOVA, and linear regression.
- Non-parametric tests do not assume a specific distribution and are used for data that doesn’t meet the normality assumption.
- Example: Chi-square tests are used when data is categorical and does not fit a normal distribution.
Inferential Statistics vs. Descriptive Statistics
- Descriptive statistics focuses on summarizing and describing sample data using measures like the mean, median, and standard deviation.
- Inferential statistics uses sample data to make inferences, test hypotheses, and predict outcomes for a larger population.
Example:
- Descriptive: Calculating the average salary of employees in a company using data from a sample of 100 employees.
- Inferential: Using this sample data to predict the average salary of all employees in the company.
Using Descriptive Statistics for Inferences
Before applying inferential statistics, it’s essential to use descriptive statistics to summarize and understand the sample data:
- Example: Calculating the mean, median, and standard deviation of a survey’s results to summarize the data.
- Once the data is summarized, inferential statistics can be used to make predictions and test hypotheses.
Hypothesis Testing
- Hypothesis testing is a key component of inferential statistics. It involves testing a null hypothesis (H0) against an alternative hypothesis (H1) to see if there’s enough evidence to reject the null hypothesis.
- Example: Testing if a new drug treatment leads to a statistically significant improvement in patients compared to a placebo.
Statistical Analysis: Making Predictions with Regression
- Regression analysis is a popular method in inferential statistics used to predict outcomes and examine relationships between variables.
- Example: Using linear regression to predict sales revenue based on the amount of advertising spent.
Confidence Interval and Statistical Inference
- A confidence interval provides a range of values that likely includes the true population parameter.
- Example: A 95% confidence interval for the average height of a population might be between 5’6” and 5’8”. This means we are 95% confident the true mean height falls within this range.
Sample Size and Variability in Inferential Statistics
- The sample size influences the accuracy of inferential statistics. Larger sample sizes tend to provide more reliable estimates of the population.
- Example: Alarger sample size in a survey about consumer preferences will likely reduce variability and provide a more accurate estimate of the population’s preferences.
Step-by-Step Guide on Using Excel for Inferential Statistics
Inferential statistics is a branch of statistics that helps make predictions or draw conclusions about a larger population from a sample. Excel is a powerful tool for conducting inferential statistical analysis, from hypothesis testing to regression analysis. Here, we’ll walk through a basic step-by-step guide using Excel to perform some common inferential statistics tests and methods, with examples and instructions.
1. Descriptive or Inferential Statistics?
Before diving into inferential statistics, it’s important to distinguish between descriptive and inferential statistics:
- Descriptive statistics provide a summary of the sample data, including measures like the mean, median, mode, and standard deviation.
- Inferential statistics, on the other hand, allows you to make predictions or generalizations about a larger population based on sample data.
Example: If you’re analyzing a dataset of test scores, you would first use descriptive statistics (such as calculating the mean and standard deviation) to understand the central tendency and variability in the data. Then, you might use inferential statistics to make inferences about the entire population of test takers.
2. Inferential Statistical Methods in Excel
Excel offers several tools and functions for performing inferential statistics, such as hypothesis testing, confidence intervals, and regression analysis. The goal of inferential statistics is to use sample data to make conclusions or predict outcomes for a broader population.
3. Using Excel for Hypothesis Testing (T-test)
T-tests are used to compare the means of two groups to determine if there is a statistically significant difference between them.
Step-by-Step Process:
- Prepare the Data: Have two sets of data, such as Group A and Group B test scores.
- Enter Data into Excel: Put Group A data in one column and Group B data in another.
- Perform T-test:
- Click on the Data tab, then select Data Analysis.
- Choose t-Test: Two-Sample Assuming Equal Variances (or Unequal Variances based on the data).
- Input the data range for each group, select the alpha level (typically 0.05), and click OK.
- Interpret Results:
- The output will provide a p-value. If the p-value is less than 0.05, reject the null hypothesis and conclude there is a significant difference.
4. Creating Confidence Intervals
A confidence interval gives a range within which a population parameter, like the mean, is likely to fall.
Step-by-Step Process:
- Data Preparation: Enter the sample data into Excel.
- Calculate the Mean and Standard Deviation:
- Use the AVERAGE function to calculate the mean of your sample data.
- Use the STDEV function to find the standard deviation.
- Determine the Confidence Interval:
- Calculate the standard error by dividing the standard deviation by the square root of the sample size.
- Multiply the standard error by the t-value (which can be found using a t-distribution table based on your alpha level and degrees of freedom).
- Add and subtract this value from the mean to get the upper and lower limits of your confidence interval.
- Formula in Excel:
=AVERAGE(A1:A30) ± T.INV.2T(0.05, 29) * STDEV(A1:A30)/SQRT(COUNT(A1:A30))
5. Regression Analysis in Excel
Regression analysis is used to model the relationship between a dependent variable and one or more independent variables. Linear regression is one of the most common forms used for this purpose.
Step-by-Step Process:
- Data Entry: Input your independent variable (e.g., marketing spend) in one column and the dependent variable (e.g., sales) in another column.
- Perform Linear Regression:
- Click on Data and select Data Analysis.
- Choose Regression from the list of tools.
- Input the Y Range (dependent variable) and the X Range (independent variable).
- Interpret Results:
- The output will give you the regression equation (e.g., Y = mX + b) and the R-squared value, which shows the strength of the relationship between the variables.
- p-values will indicate whether the coefficients are statistically significant.
6. Descriptive and Inferential Statistics
While descriptive statistics help summarize and organize the sample data, inferential statistics allows you to make predictions or generalizations about the larger population. Both types of statistics complement each other:
- Descriptive statistics: Measures of central tendency (mean, median, mode) and variability (standard deviation).
- Inferential statistics: Tests like t-tests, ANOVA, and regression analysis.
7. Using Excel for Statistical Analysis
- Inferential statistics are used to test hypotheses and make generalizations from a sample to a population. Excel’s built-in functions like t-tests, regression, and confidence intervals are used to analyze the data and draw conclusions.
Examples of Statistical Tests in Excel:
- t-tests: Used to compare the means of two groups.
- Analysis of variance (ANOVA): Used to compare more than two groups.
- Chi-square tests: Used for categorical data analysis.
8. Statistical Methods for Inferences
- Inferential statistics includes methods like confidence intervals, hypothesis testing, and regression analysis to make predictions and generalizations about a population based on sample data.
- Example: Regression analysis in Excel allows you to model relationships and predict future outcomes based on historical data.
9. Descriptive Statistics vs. Inferential Statistics
- Descriptive statistics summarizes data and presents it in a manageable form using mean, median, and standard deviation.
- Inferential statistics, on the other hand, allows you to make inferences, predict future trends, and test hypotheses about a larger population based on the sample data.
10. Inferential Statistics Help in Research Design
Inferential statistics plays a key role in research design by allowing researchers to test hypotheses and make predictions. The goal of inferential statistics is to use sample statistics to draw conclusions about a population from which the sample was drawn.
- Example: Researchers conducting a survey on public opinion use inferential statistics to generalize findings to the entire population.
11. Conclusion: Inferential Statistics in Action
Excel provides a variety of tools to help you apply inferential statistics methods such as t-tests, regression analysis, and confidence intervals. By using sample statistics and applying these techniques, you can make inferences about a larger population, test hypotheses, and predict outcomes with a high degree of confidence.
If you’re looking to analyze data and draw statistical conclusions, mastering inferential statistics in Excel is a must. It allows you to understand and interpret data more effectively, making it an invaluable tool for any researcher.
The Power of Inferential Statistics
Inferential statistics is a powerful tool for researchers, businesses, and analysts to make generalizations, predictions, and decisions based on sample data. Unlike descriptive statistics, which simply summarize data, inferential statistics allows us to test hypotheses, estimate population parameters, and make inferences with a known level of confidence.
Whether you are using regression analysis, hypothesis testing, or confidence intervals, inferential statistics enables you to draw conclusions and make data-driven decisions that have far-reaching implications. Understanding and applying inferential statistics is essential for any researcher looking to analyze data in depth and make informed predictions about a larger population.
Inferential Statistics Methods
There are several methods used in inferential statistics to analyze sample data and make conclusions about a population:
- Confidence Intervals: Estimate a population parameter (e.g., mean or proportion) within a range.
- Example: A survey indicates that 62% of the sample supports a new policy, with a 95% confidence interval of ±3%. This means the true proportion of the population is likely between 59% and 65%.
- Regression Analysis: Assesses the relationship between independent variables and a dependent variable, and can be used to predict future outcomes.
- Example: Regression analysis predicting future sales based on marketing expenditure.
- Analysis of Variance (ANOVA): Used when you want to compare the means of more than two groups.
- Example: Comparing the test scores of students across three different teaching methods.
Descriptive Statistics vs. Inferential Statistics
While descriptive statistics focuses on summarizing and presenting the data as-is, inferential statistics goes a step further by making predictions and generalizations about a larger group (population) based on the sample data.
- Descriptive statistics: Summarize data without making predictions (e.g., calculating mean, median, mode).
- Inferential statistics: Uses sample data to make inferences or predictions about a larger population (e.g., t-tests, regression analysis, confidence intervals).
Example: If you have a sample of 100 students’ exam scores, you might use descriptive statistics to calculate the average score. Then, you could use inferential statistics to predict how the entire student body might perform based on your sample.
Inferential Statistics Help with Data Analysis
Inferential statistics helps researchers and analysts to go beyond simple data description and make valuable predictions, test hypotheses, and draw conclusions that can impact decisions.
- Example: By analyzing sample data, regression analysis can predict future sales of a company based on current marketing trends.
- Inferential statistics also provides statistical tests to assess confidence intervals and ensure results are statistically significant.
Conclusion: The Importance of Inferential Statistics
Inferential statistics is an essential branch of statistics used in various fields such as social sciences, business analysis, and health research. By applying techniques like hypothesis testing, regression analysis, and confidence intervals, it allows us to make meaningful conclusions, predict outcomes, and generalize findings from a sample to a larger population.
In contrast to descriptive statistics, which simply summarizes data, inferential statistics empowers researchers to draw actionable insights and make data-driven decisions.
FAQs: Inferential Statistics Examples: Definition, Uses, and Examples
What is an example of a statistical inference?
- Statistical inference is used to draw conclusions or make predictions about a larger population based on sample data.
- Example: Using the average test score from a sample of students to infer the average score for an entire school district.
- Inferential statistics allow you to test hypotheses and make predictions about a broader population.
- Inferential statistics is a branch that uses sample statistics to estimate population parameters.
What is the difference between descriptive and inferential statistics?
- Descriptive statistics summarize and describe characteristics of a data set using measures like mean, median, mode, and standard deviation.
- Inferential statistics go a step further by making inferences or generalizations about a larger population using sample data.
- Descriptive statistics are typically used to summarize the data, while inferential statistics are used to test hypotheses and make predictions.
- Descriptive statistics describe the sample, whereas inferential statistics make conclusions about the population.
What is a real-life example of descriptive statistics?
- Example: A survey on monthly spending where the mean, median, and mode of spending are calculated to summarize how much individuals typically spend each month.
- Descriptive statistics are typically used to summarize the characteristics of a data set in a simple and understandable manner.
Is the mean an example of inferential statistics?
- No, the mean is an example of descriptive statistics. It is used to calculate the central tendency of a data set.
- Inferential statistics would use the mean from a sample to make inferences about the mean of the broader population.
- Statistics are used to make predictions or test hypotheses, such as using the sample mean to estimate the population mean.